Dividend Data
Access comprehensive stock data, including 30 years of dividends and financials, instantly in Google Sheets and Excel.
Visit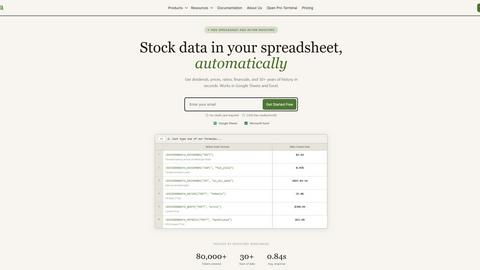
About Dividend Data
Dividend Data is a powerful tool designed to bring extensive stock market data directly into your spreadsheets, specifically Google Sheets and Microsoft Excel. With over 30 years of historical data covering more than 80,000 tickers, it offers invaluable resources for dividend and fundamental investors. The platform provides instant access to crucial metrics such as dividends, yields, payout ratios, growth rates, financial statements, earnings, and various ratios. Users can utilize simple custom formulas to retrieve live data, eliminating the need for API keys, coding, or tedious copy-and-paste tasks. The service is built by a dividend investor, making it tailored to meet the specific needs of those focused on dividend returns. With a free tier offering 2,500 monthly credits and no expiration on trials, Dividend Data is accessible for both novice and experienced investors looking for institutional-grade data without the hefty price tag.
Features of Dividend Data
Free Tier with Monthly Credits
Dividend Data offers a generous free tier that provides users with 2,500 monthly credits. This means you can start accessing valuable stock market data without any upfront cost or trial expiration, making it an attractive option for both beginners and seasoned investors.
Extensive Historical Data
With over 30 years of historical stock market data, Dividend Data enables investors to analyze trends and make informed decisions. This extensive data coverage allows users to evaluate stocks thoroughly, enhancing their investment strategies with reliable historical insights.
16 Custom Functions
The platform features 16 custom functions specifically designed for dividend investors. These functions allow users to easily access essential metrics such as dividend yields, payout ratios, and earnings, streamlining the analysis process and saving valuable time.
Seamless Integration with Spreadsheets
Dividend Data integrates seamlessly with both Google Sheets and Microsoft Excel. This enables users to retrieve live data directly into their spreadsheets using simple formulas, allowing for efficient data management and real-time analysis without any technical hurdles.
Use Cases of Dividend Data
Portfolio Management
Dividend Data is ideal for portfolio managers who need to track multiple investments. By using its custom functions, users can easily monitor dividends, earnings, and price history, ensuring they have all the necessary information at their fingertips for effective portfolio management.
Fundamental Analysis
Investors focusing on fundamental analysis will benefit from Dividend Data's comprehensive metrics. With access to financial statements and key ratios, users can make well-informed investment decisions based on the financial health of companies.
Dividend Strategy Development
For those developing dividend-focused investment strategies, Dividend Data provides the tools necessary to analyze potential dividend stocks. Users can quickly access growth rates, payout ratios, and historical dividend data to build a robust dividend strategy.
Automated Reporting
Dividend Data allows for the automation of reporting processes. By utilizing its functions within spreadsheets, investors can generate reports on stock performance, dividend payments, and financial ratios, saving time and effort while ensuring accuracy.
Frequently Asked Questions
How does Dividend Data integrate with Google Sheets and Excel?
Dividend Data offers add-ons for both Google Sheets and Microsoft Excel, allowing users to pull data directly into their spreadsheets using custom functions without any coding knowledge required.
Is there a cost associated with using Dividend Data?
Dividend Data provides a free tier that includes 2,500 monthly credits, allowing users to access stock data without any initial investment. Higher usage may require a paid plan, but users can start without a credit card.
What types of data can I access with Dividend Data?
Users can access a wide range of data, including dividends, yields, financial ratios, price history, earnings, and over 100 additional metrics, all designed to aid in investment decision-making.
Can I use Dividend Data for real-time stock analysis?
Yes, Dividend Data provides live data updates in your spreadsheets, enabling real-time stock analysis. This immediate access allows investors to react quickly to market changes and make timely investment decisions.
Explore more in this category:
Top Alternatives to Dividend Data

Liners Africa
Liners Africa is your comprehensive guide to discover, compare, and review software solutions tailored for the African market.

VolRadar
VolRadar delivers daily options analytics for premium sellers, ranking 500+ S&P stocks by volatility edge with computed strikes for 30-second morning.
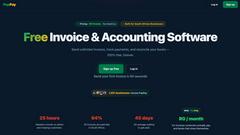
PopPay
PopPay is a free, SARS-compliant invoice and accounting software for South African small businesses, integrating seamlessly with WhatsApp and EFT.

StockFit API
StockFit API delivers structured SEC data for precise financial modeling, valuation, and backtesting for investors and researchers.

CalcFi
CalcFi offers 300+ free financial calculators that integrate federal data to provide a comprehensive financial overview tailored to your needs.

Wize Finance Eligibility Check
Wize Finance Eligibility Check lets UK limited companies explore business loan options and funding eligibility without impacting their credit score.

Ember
Ember leverages three independent AI models to identify high-conviction market signals by tracking discrepancies in real-time predictions.
Stockdrifts
StockDrifts empowers investors with AI-driven insights from global insider trades and filings to enhance research and decision-making.