Fallom vs Fusedash
Side-by-side comparison to help you choose the right product.
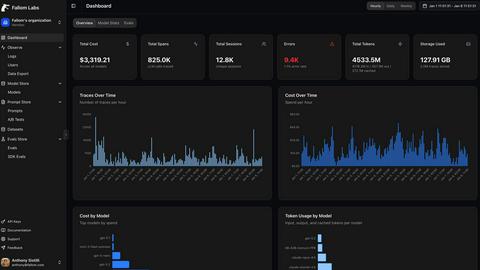
Fallom is an AI-native observability platform that provides real-time insights and analytics for LLMs and agents.
Last updated: February 26, 2026
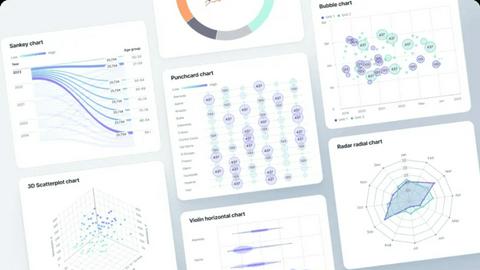
Fusedash is an AI data visualization platform that transforms raw data into actionable dashboards and reports.
Last updated: March 3, 2026
Visual Comparison
Fallom
Fusedash
Feature Comparison
Fallom
Real-Time Observability
Fallom offers real-time observability for AI agents, allowing users to track every tool call in detail. This feature enables comprehensive analysis of timing, latency, and costs associated with LLM calls, fostering a deeper understanding of operational performance.
Cost Attribution
With Fallom, organizations can achieve full transparency over their AI-related expenditures. The platform allows users to track costs per model, user, and team, facilitating accurate budgeting and chargeback processes essential for financial accountability.
Compliance Ready
Fallom is engineered to meet stringent regulatory requirements, offering full audit trails that support compliance with frameworks such as the EU AI Act, SOC 2, and GDPR. Features include immutable logs, input/output tracking, model versioning, and consent management.
Session Tracking
This feature groups traces by session, user, or customer, providing complete context for every LLM interaction. It allows organizations to analyze user behavior and interactions, enhancing insights into application performance and user engagement.
Fusedash
Unified AI Visualization Workspace
Fusedash consolidates every stage of the data workflow into a single, cohesive platform. Users can connect data from CSVs, APIs, or databases and immediately leverage it to create dashboards, charts, maps, and narrative storytelling reports. This eliminates the friction of switching between multiple specialized tools. The integrated AI assists throughout, from suggesting optimal chart types to generating quick summaries, ensuring that data presentation is both efficient and impactful, all within one environment.
AI Chart Generator
This feature allows users to rapidly create publication-ready visualizations from their datasets. By simply uploading a CSV or connecting an API, the AI analyzes the data and recommends the most effective chart types to communicate the story. Users can then instantly apply comparisons, filters, and clear labels. These charts can be used as standalone assets for presentations or seamlessly embedded into larger dashboard views, dramatically speeding up the report creation process.
Consistent KPI & Metric Definitions
A foundational feature for maintaining data integrity, Fusedash enables teams to define key performance indicators, dimensions, and calculations once. These standardized definitions are then reused across every dashboard, chart, and report. This ensures that when leadership reviews a KPI dashboard and the marketing team examines a performance chart, they are both looking at numbers calculated the same way, fostering trust and eliminating debates over data accuracy.
Smart AI Chat for Data Exploration
Fusedash includes an intelligent chat interface that allows users to interact with their data using natural language. Team members can ask questions like "What were sales in Q4 by region?" or "Show me a breakdown of website traffic sources." The AI interprets these queries, provides answers, suggests relevant metrics, and can even transform the insights into new, shareable dashboard views. This makes deep data exploration accessible to non-technical stakeholders.
Use Cases
Fallom
Debugging Multi-Step Agents
Fallom is indispensable for teams developing multi-step agents, as it provides timing waterfalls that help identify latency issues within workflows. This allows engineers to optimize performance and improve user experience through better debugging.
Regulatory Compliance Management
Organizations operating in regulated industries can leverage Fallom to maintain compliance effortlessly. With comprehensive audit trails and user consent tracking, businesses can demonstrate adherence to necessary legal standards while managing LLM operations.
Cost Management in AI Deployments
With the cost attribution feature, companies can meticulously track their AI spending on a granular level. This empowers teams to identify cost-saving opportunities and allocate resources more effectively across various models and user groups.
Performance Monitoring and Evaluation
Fallom offers real-time dashboards for monitoring LLM usage, enabling teams to spot anomalies and performance issues before they escalate. This proactive approach helps maintain the reliability of AI systems and enhances overall operational efficiency.
Fusedash
Executive KPI Review Dashboards
Leadership teams require a high-level, real-time view of organizational health. Fusedash is used to build centralized executive dashboards that aggregate key metrics from across departments—such as revenue, customer acquisition costs, and operational efficiency. The consistent KPI definitions ensure reliability, while storytelling sections can add crucial context to explain fluctuations, enabling faster, more informed strategic decisions.
Marketing and Revenue Performance Tracking
Marketing and sales teams use Fusedash to track campaign performance, funnel conversion rates, and ROI. They can connect data from ad platforms, CRMs, and web analytics to create unified views. The ability to filter by segment, channel, or time period, and drill down into specific data points, helps teams identify what's working, optimize spend, and accurately report on performance to stakeholders.
Operations and Real-Time Monitoring
For teams managing logistics, infrastructure, or customer support, minutes matter. Fusedash's real-time interfaces support monitoring fast-moving metrics like system uptime, transaction volumes, or support ticket backlogs. Live dashboards provide instant visibility into operations, allowing teams to detect and respond to issues proactively before they escalate, ensuring smooth business continuity.
Geographic Analysis with Map Visualizations
Organizations with physical locations, distribution networks, or regional sales teams leverage Fusedash's built-in mapping capabilities. By visualizing data such as sales density, customer demographics, or asset locations on an interactive map, teams can uncover geographic trends, optimize territory management, and make data-driven decisions about where to allocate resources for maximum impact.
Overview
About Fallom
Fallom is a cutting-edge, AI-native observability platform designed specifically for managing large language model (LLM) and agent workloads. It empowers organizations to monitor and analyze every LLM call made in production environments through comprehensive end-to-end tracing. Key aspects captured include prompts, outputs, tool calls, tokens utilized, latency, and the cost associated with each call. Fallom is tailored for enterprises needing robust compliance measures, providing session, user, and customer-level context as well as detailed timing waterfalls for multi-step agents. Its enterprise-ready features include audit trails, logging, model versioning, and user consent tracking, ensuring adherence to regulatory standards. With a streamlined OpenTelemetry-native SDK, teams can easily instrument applications in just minutes, enabling real-time monitoring, rapid debugging, and precise cost attribution across various models, users, and teams.
About Fusedash
Fusedash is an AI-powered data visualization and business intelligence platform designed to transform complex, connected data into clear, actionable insights. It serves as a unified workspace where teams can build decision-ready dashboards, interactive charts, detailed maps, and narrative reports without the need to rebuild logic across disparate tools. The platform's core value proposition lies in its ability to centralize data definitions and workflows, enabling organizations to maintain a single source of truth. By allowing users to define KPIs and metrics once and reuse them consistently across all visualizations and reports, Fusedash eliminates conflicting data stories and ensures every stakeholder is aligned. It is built for modern teams across functions—from leadership and marketing to operations and sales—who need to monitor performance, explain changes, and act on insights quickly. With integrated AI capabilities for natural language querying, visualization generation, and summarization, Fusedash significantly reduces the time from data to decision, empowering teams to focus on strategic action rather than manual report-building.
Frequently Asked Questions
Fallom FAQ
What is Fallom?
Fallom is an AI-native observability platform that provides comprehensive monitoring and analysis of LLM and agent workloads, enabling organizations to optimize performance and ensure compliance.
How does Fallom ensure compliance?
Fallom includes features like audit trails, input/output logging, model versioning, and user consent tracking, all designed to help organizations meet regulatory standards such as GDPR and SOC 2.
Can Fallom be integrated easily?
Yes, Fallom utilizes a single OpenTelemetry-native SDK that allows teams to instrument their applications quickly and monitor usage with minimal overhead, typically in under five minutes.
What kind of analytics does Fallom provide?
Fallom delivers detailed analytics on LLM calls, including timing, cost attribution, performance metrics, and session tracking, which collectively allow organizations to gain deeper insights into their AI deployments.
Fusedash FAQ
What types of data sources can I connect to Fusedash?
Fusedash offers flexible data integration options to suit various needs. You can start quickly by uploading CSV or Excel files directly into the platform. For live, updated data, you can connect to a wide range of APIs from business applications like Salesforce, Google Analytics, and ad platforms. This allows you to combine multiple datasets into a single, comprehensive view for analysis and reporting.
How does the AI in Fusedash assist with data visualization?
The AI in Fusedash acts as an intelligent assistant throughout the visualization process. It can generate appropriate charts from your raw data with a single click, suggest optimal chart types and metrics based on your questions in Smart Chat, and help refine visuals by recommending better labels or comparisons. It essentially accelerates the design process and helps ensure your visualizations clearly communicate the intended story.
Can I create different views for different teams from the same data?
Absolutely. This is a core strength of Fusedash. You can build a single, centralized dataset with consistent KPIs and then create multiple tailored views from it. For example, you can craft a high-level dashboard for executives, a detailed chart report for the marketing team, and a real-time monitoring view for operations—all sourcing the same underlying data, ensuring consistency while meeting each audience's specific needs.
What is "Storytelling" within Fusedash reports?
Storytelling is a feature that moves beyond static charts and numbers. It allows you to add narrative context, annotations, and explanatory text directly alongside your visualizations in a report. This helps answer the critical questions of why a metric changed and what should be done next, providing crucial context for stakeholders and turning a simple dashboard into a compelling, actionable business narrative.
Alternatives
Fallom Alternatives
Fallom is an innovative, AI-native observability platform designed to provide real-time insights and analytics for large language models (LLMs) and agents. As organizations increasingly adopt AI technologies, they often seek solutions that allow them to effectively monitor and manage their LLM workloads. Users typically explore alternatives to Fallom for various reasons, including pricing, specific feature requirements, or the need for different platform integrations that better align with their operational workflows. When choosing an alternative, it's essential to consider factors such as the comprehensiveness of observability features, compliance capabilities, cost transparency, and the ease of integration with existing systems. Additionally, evaluating the scalability and support offered by the platform can help ensure it meets both current and future organizational needs.
Fusedash Alternatives
Fusedash is an AI-powered data visualization platform in the analytics and data category. It enables teams to build interactive dashboards, charts, and maps from a single dataset, using AI to generate summaries and answer natural language queries. Users may explore alternatives for various reasons, including budget constraints, specific feature requirements like advanced modeling, or the need for deeper integration with an existing enterprise software stack. The search often stems from a need for a different balance between ease-of-use, customization, and analytical depth. When evaluating alternatives, key considerations include the platform's core data visualization capabilities, the sophistication of its AI and natural language processing, real-time data handling, and the overall cost-to-value ratio for your team's specific use cases. The ideal solution should align with both your technical requirements and strategic business intelligence goals.